
Australia’s permanent migrants: what the income and housing data show
 by
Babylon Radio
Listen nowPermanent migrants aged 15–64 in Australia had median total income of A$70,762 in 2023–24, according to the Australian Bureau of Statistics’ Migrant settlement outcomes release, published on 22 September 2026.
For someone planning a move, that figure needs context. It describes a broad group at a past point in time. Treating it as an expected starting salary would give a misleading picture of what your first year might look like.
Income and employment measure different things
These figures cover people aged 15–64 in the relevant permanent-migrant population:
Median total income in 2023–24; share employed in 2021, for people aged 15–64
- Skilled: A$83,466, 81.8% employed
- Family: A$58,926, 68.2% employed
- Humanitarian: A$43,910, 46.0% employed
- All: A$70,762, 74.3% employed
Source: ABS data tables 3b and 3c. The total also includes other permanent migration streams.
Total income includes wages, business and investment income, superannuation income, government payments and other income. It is broader than pay from a job. The ABS methodology also warns against directly comparing these figures with its separate Personal Income in Australia series, which uses different coverage and visa-selection rules.
The employment column is a share of the working-age population, not a job-offer success rate. It cannot tell you how many applications a new arrival will need, whether their qualifications will be recognised or what an employer will pay.
Home ownership was lower among recent arrivals
In 2021, 62% of permanent migrants lived in an owned home. That compared with 38% among those in Australia for less than five years and 71% among those there for more than ten years. These housing measures cover people in occupied private dwellings, rather than only working-age adults.
Among permanent-migrant homeowners with a mortgage, 21% spent more than 30% of household income on repayments, compared with 14% of all Australian homeowners with a mortgage. See the ABS housing findings.
The arrival groups are different populations, not a forecast tracking one newcomer towards home ownership. Nor do the mortgage figures describe today’s repayments: their reference year is 2021.
Check the population before using the numbers
The release draws on linked administrative records and Census data. It concerns a defined permanent-migrant population, not everyone born overseas or everyone holding a temporary visa. The ABS notes that missing information can affect coverage, so some people do not contribute to every topic. It also flags the unusual conditions of the COVID-19 period.
Before using a national median in a relocation budget, make three separate checks:
- Work: compare actual vacancies and salary terms for your occupation and intended location.
- Housing: price the type of home and neighbourhood you would use, rather than assuming an ownership rate tells you what is affordable.
- Timing: distinguish the publication date from the year each statistic measures.
For a more recent look at hiring demand, read our guide to Australia’s 2026 Occupation Shortage List.
Figures checked on 31 October 2026. Statistics: Australian Bureau of Statistics, Migrant settlement outcomes, 2026, tables 3b, 3c and 6; CC BY 4.0. Interpretation by Babylon.
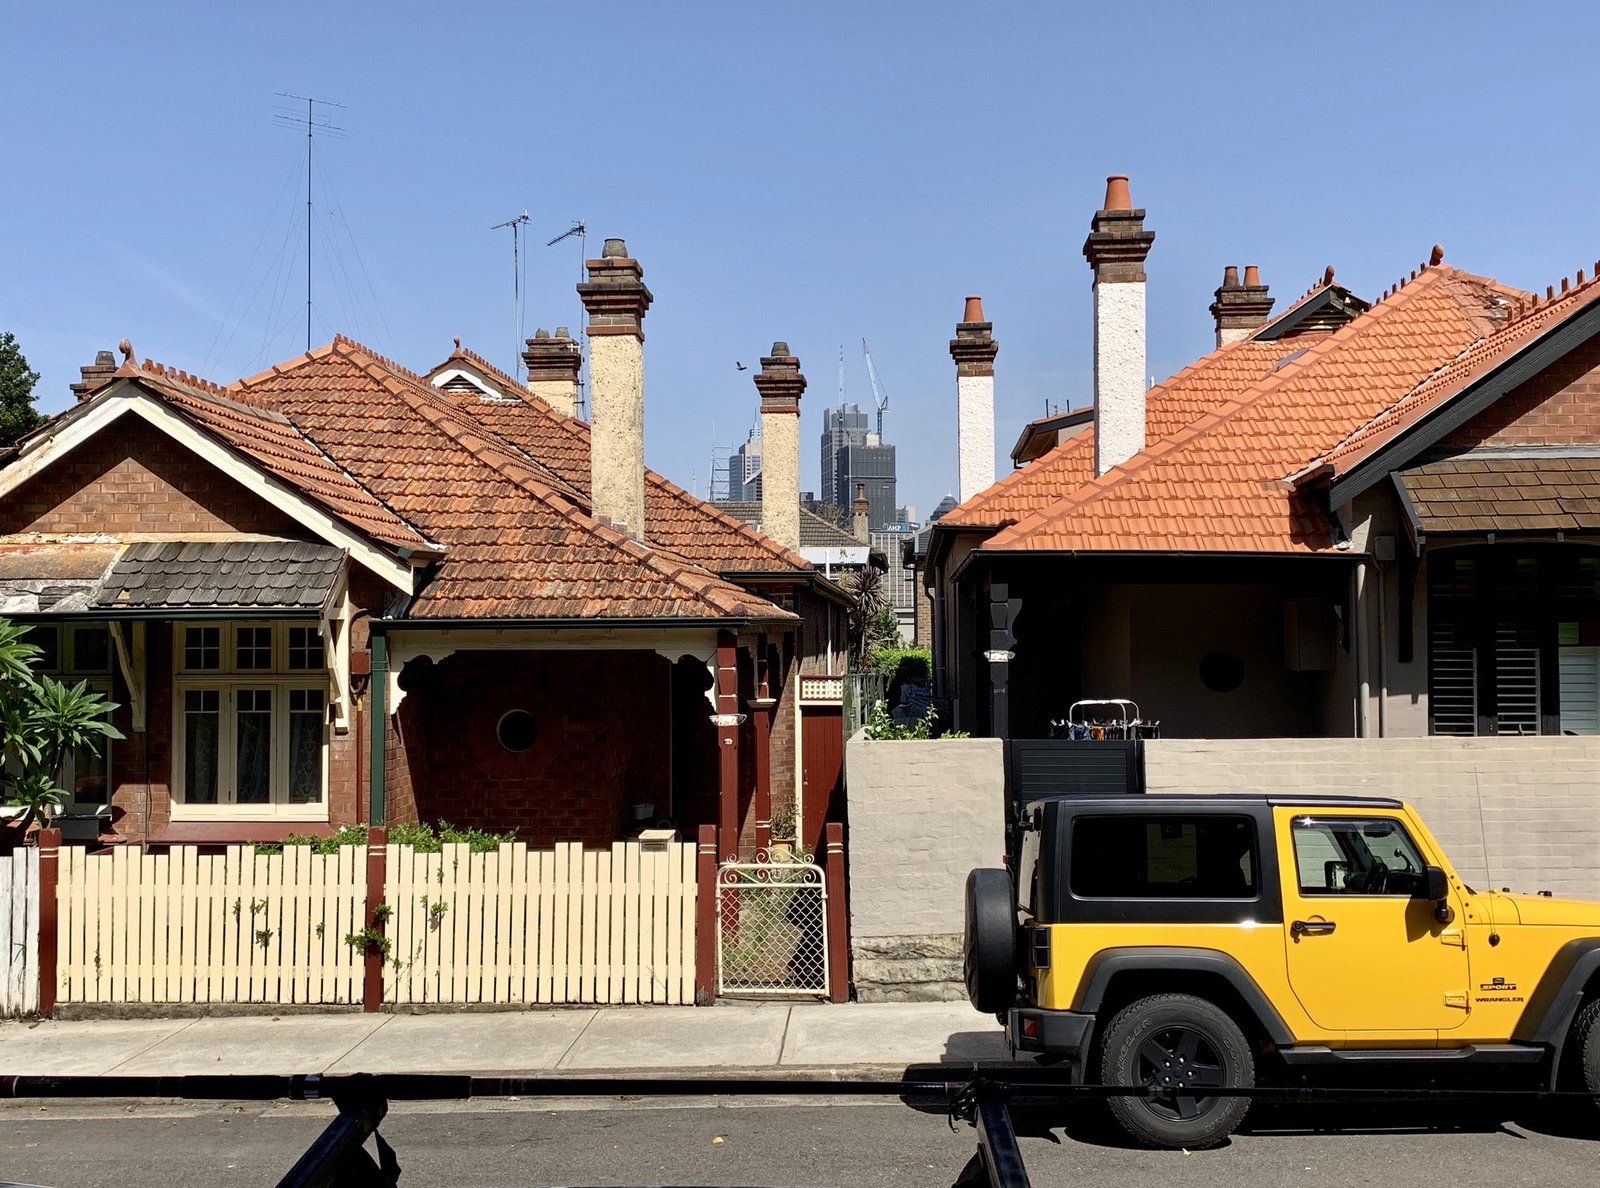
Featured photograph: homes on Kirribilli Avenue, Sydney, photographed in March 2019. Archive housing illustration, not homes identified in the study. Photo: Kgbo / Wikimedia Commons, CC BY-SA 4.0.